While trading, stops and targets are paramount, there is one thing that I have always noticed about traders, that most of them always have an idea of what to stock to buy/sell but that’s only one part of the game, very few traders actually manage to get the correct stops and correct targets in a trade and that makes a huge difference in what your outcome can be.
And if you are an intraday player – this becomes all the more vital.
Both these levels will have to be dictated by the market, the market is paramount and our method of finding exits should also be in line with the market.
In this article, I want to highlight two simple but very powerful tools that can help you do that
ATR as a Stop loss/ Target Mechanism
- The average true range (ATR) is a market volatility indicator used in technical analysis. The true range indicator is taken as the greatest of the following: current high less the current low; the absolute value of the current high less the previous close; and the absolute value of the current low less the previous close. The ATR is then a moving average, generally using 14 days, of the true ranges
- ATR is an absolute figure. This figure is displayed against the name on the ATR page or shown separately under the Levels table.
- This figure shows the average range that the stock has exhibited over the past 14 periods (of chosen time frame).
- Since the future range of price movements are often governed by past price action, it is expected that the ATR figure shown can be used to gauge what can be the movement in the next candle.
- The ATR figures are used directly to calculate Stops and Targets from the entry price of your trade. You can also play around with ATR figure as per your convenience; for e.g. one time of the ATR can be used as a stop loss and 2 times of the ATR figure can be used as the target and so on. If ATR values are large, you can use a fraction of it (such as half ATR, etc.) for placing stops and targets.
- ATR figures are market-generated numbers. Using these for stops and targets makes more sense because using random Rupees as stops and targets makes it arbitrary. So is using percentages of price. Hence using ATR figures, we can be more oriented to the actual movement of the stock.
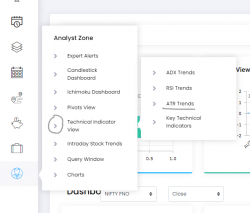
NeoTrader has created a dedicated page for ATR indicator and this is available under the tab Technical indicators.
To read more about this click here – https://neotrader.in/static/pdf2/ATR_Trends.pdf
Using the Pivots Points
Pivots are a very handy tool, as it quickly gives out levels on both the upside and downside for a stock aiding decision making. Secondly, pivots give out a whole range of levels; you can pick whatever pivot method you want and you will get a range of levels above and below you entry price – those can be used for stops and targets. Moreover, multiple pivots tend to cluster around certain zones, these areas can act as suitable support/resistance zone helping us plan our trade.
Use NeoTrader to find this easily.
The same objective of stops and targets can be obtained by using the Pivots page in NeoTrader.
It’s a simple process
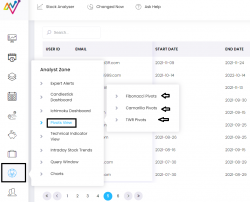
- Choose the pivot method(Fibonacci, Camarilla, CPR) and
- Then go to the Levels page, type in the name of the stock, choose the time frame and check the different levels mentioned under the different pivot expansions.
- Use any of those for targets and stops.
- You can get all the time frame in one place also in the Stock analyser page of the stock.
- Check for clusters of different time frames to get a better support or resistance area.
If you use stops and targets correctly in every trader, you will be successful most of the time and if you use NeoTrader along with your trades, you will never be bereft of stops and targets.
Best Regards,
Aditya Iyer
Co-Founder – NeoTrader
Thankyou the above indi
Catir are available with neolite yrly subscription?