
We are pleased to announce that we have added some enhancement to the candlestick page which should make it easier for you users to navigate and select stocks.
1.Candlestick Pattern Heatmap
We have created a new heat map that will automatically give you all the stocks that qualify on the basis of various candle stick patterns with readymade bullish and Bearish signals.
Green – Bullish, Red = Bearish, and Yellow = where Signals don’t apply.
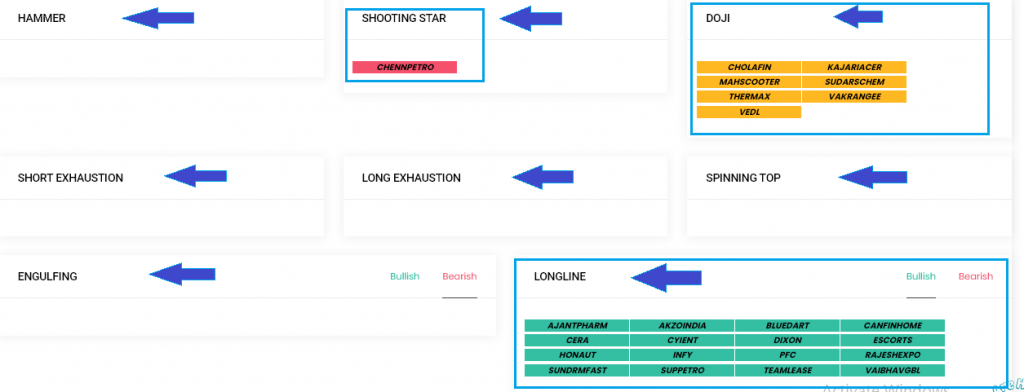
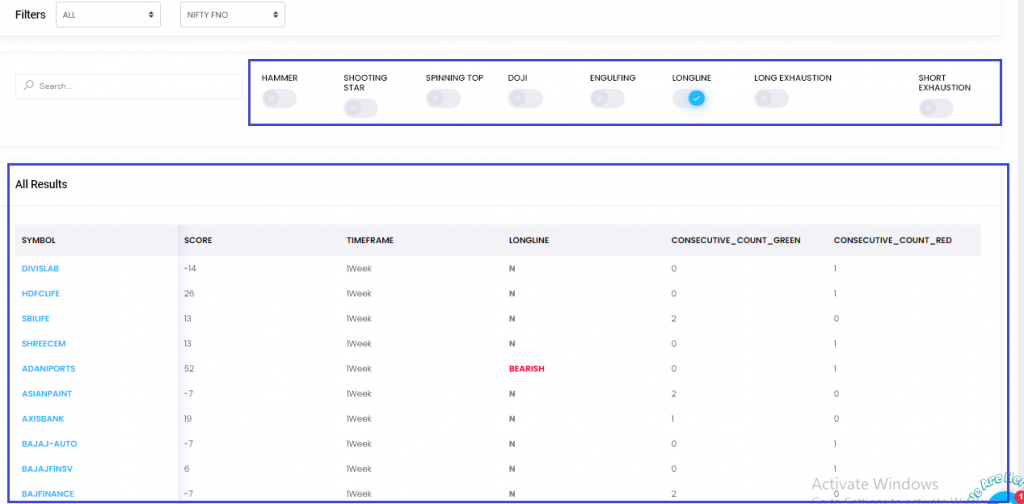
There are various candlesticks pattern based modules on the page (marked with blue arrows)
When you have active signals on the module you will see the name of the stock appear with color coding (Shown in Blue Box).
For Eg, in the below module you can see all the stocks that are showing a bullish long body candle on the selected time frame, at the same time you can change to toggle to bearish to get a list of bearish items.
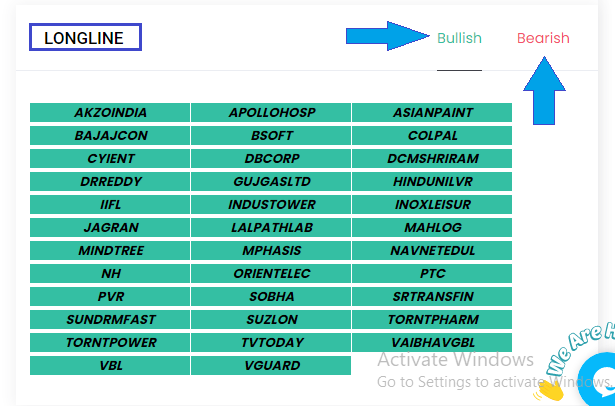
For Eg, in the below module you can see all the stocks that are showing a bullish long body candle on the selected time frame, at the same time you can change to toggle to bearish to get a list of bearish items.
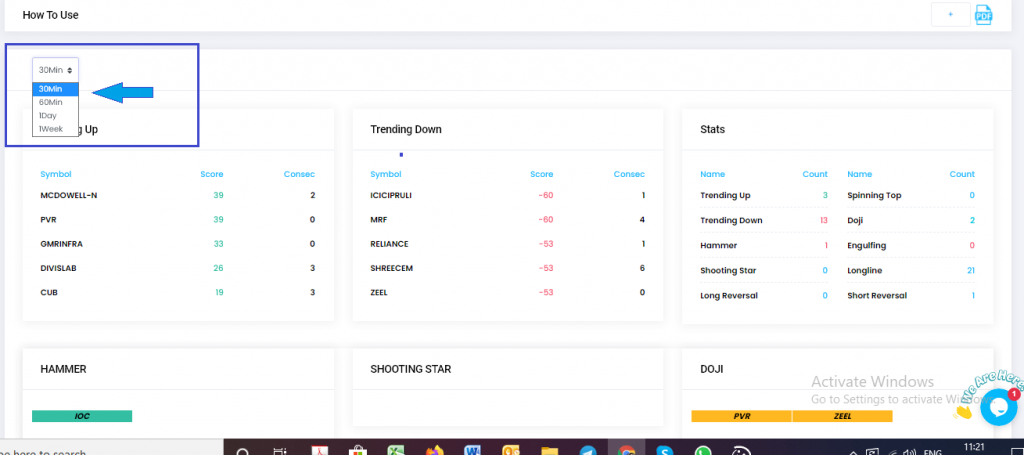
time frames it is 30,60,Day,Week
2.Candlestick pattern description
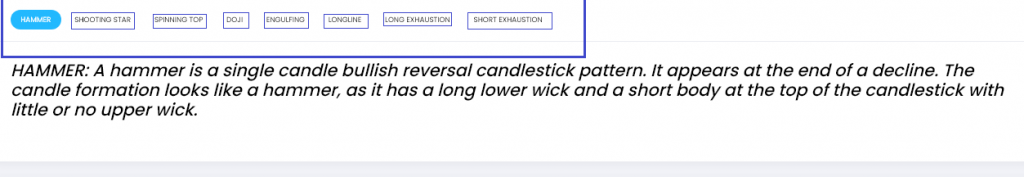
We have added a short and crisp description for every candlestick pattern which will be useful for many to understand how to use these patterns and their implications.
It is available on the top of the page. – Users can click on any pattern (marked with blue arrow in below image – to read a short description of the same.
3.A clean toggle for running queries
To improve the ease of use, we have reduced the number of elements displayed on the candle stick query function; this will help users check results with more clarity.
Checkout Our latest article by our founder Dr.CK Narayan on How to Trade better.
Visit neotrader.in to learn more!
CALL US: 8779800688 / 8779639189 / 9372325599 Or
Email Us: support@chartadvise.com